top of page
Search

HOSPITAL ACQUIRED INFECTIONS PROJECT

  • okanhasturkk
  • May 11
  • 4 min read

Updated: Jun 24


This is my Excel Project using real data obtained from State of New York. I analyzed this dataset without having any healthcare background. My motivation within this project was to be able to clean, standardize and visualize data without having any knowledge and have a sufficient exploratory data analysis.


File:


Whenever I analyze a dataset, I always create a new tab, which is "Clean_Data" here and there I cleaned my data.
In order to be analyze the data, first I had to choose the 'Filter' option under Data.

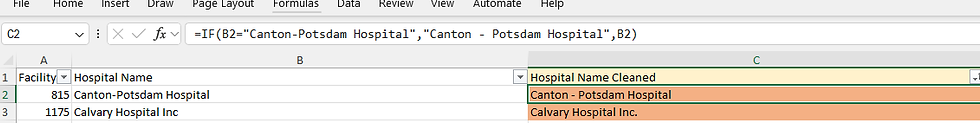
Upon cleaning the data, I came across some bad spelling, which mostly consisted of punctuation mistakes, and some spacing issues. I corrected some of these issues with formulas and some with formulas.


In order to preserve the raw data, I created these 2 "cleaned" columns to apply my formulas and corrections.

Here are some formulas that I have applied.


In this formula, I have applied 4 corrections. Adding spaces between 'Faxton' and 'St', adding a comma after 'St', adding an apostrophe after 'Luke' to separate 's' and finally removing the unnecessary 'St. Luke's Healthcare' after checking from the web that there are no other hospital with similar name. All these changes have been added to the IF statement as a condition, if the row included this name, if was updated to the corrected name, otherwise they stay untouched which has been defined by applying the row number B11011 to the 'Else' part of IF statement.
Fixing the spacing issue between 'Canton' and 'Potsdam' with IF statement.
Adding comma after 'Inc' with IF statement. This issue was the most I came across with during the cleaning.
Fixing the capital letter issue with PROPER statement.
Because this is a large dataset and there are many corrections that have been applied, I created an 'Issues' Tab to display all the corrections that I applied and because some issues can not be fixed without consulting he stakeholder or an executive, they are left unattended. BLUE color under the 'solvable' column shows the fixed issues, where as RED shows untouched issues.

This was the the data cleaning - standardization part. Afterwards, comes the EDA (exploratory data analysis) part of my analyze. I must stress here that the EDA part consists only of the SIR (Standardized Infection Rate) calculation which is obtained by the proportion of observed infections to the predicted infections, which I learned by reading the Information file found at the dataset source additionally. I am aware that there are other conditions that apply to this. Because this dataset includes time and calculation, I opted for these 3 dimensions. Time, Infections observed, Infections Predicted and the SIR. The EDA phase of the project consists of these 4 elements only. In these comparisons, hospitals that include ALL in their name, were excluded to concentrate on individual hospitals.


For my first Analyze, I copy and pasted the 'Hospital Name Cleaned', 'Infections Observed' and 'Year' columns. I wanted to compare the number of observed infections in NY Hospitals in 2022 by generating a Pivot Table.
Selecting the sum of observed infections as values, Year as column and hospital names as rows, I obtained this table and searched for top 10 hospitals with the number of observed infections and reported my findings at comment section.
For my 2nd analysis, I concentrated on the SIR value of hospitals this name. As visible at the E column, its formula have been applied to all rows and I wanted to check the the top 10 hospitals with the highest SIR rate average by year 2022 by descending order this time.
For this pivot table and chart, I preferred a different method to add my findings, which was done by Merge & Center by the home section and wrapping the text as well in order to fit the text in the chosen area.

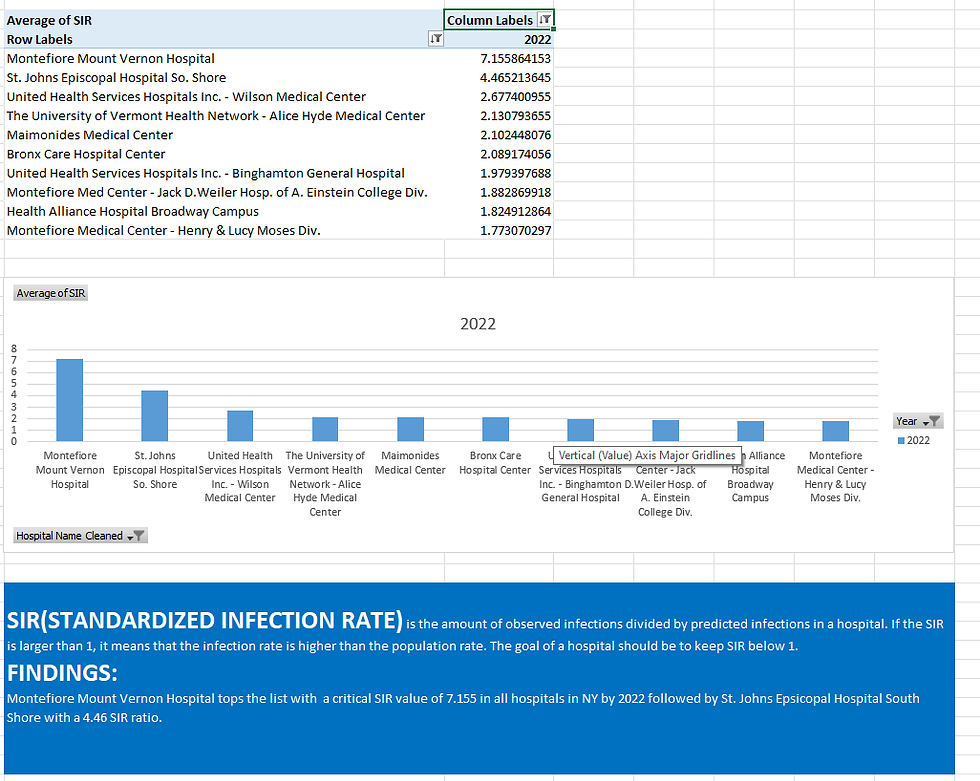
Here are examples of how I filtered and sorted the pivot table.


Filtering the year by choosing only the year 2022 under column labels.
In order to sort the findings by descending order, I clicked on one of columns on the pivot chart and then applied from the largest to smallest under sort section.

In my last Tab, I analyzed some of SIR values by conditional formatting and entered a XLOOKUP formula for a specific value. Here is how it looks.


There are 3 new columns here all related to sir. The SIR below 1 and The SIR above 1 columns are generated by copy and pasting the SIR column and then applying conditional formatting by as it follows.
After choosing the The SIR above 1 column, in order to format the whole column, I selected conditional formatting under Home/styles and then Highlight/cell rules and latest choosing the greater than tab applying the above selected formatting. The same method have been applied to all those 3 columns. For the SIR Above Average Column, the average of the SIR column has been determined by the following function:
First, I calculated the average of the whole SIR column with the Average function and then just shown above conditional formatting, I manually entered the value and chose a different color for the greater than sorting.

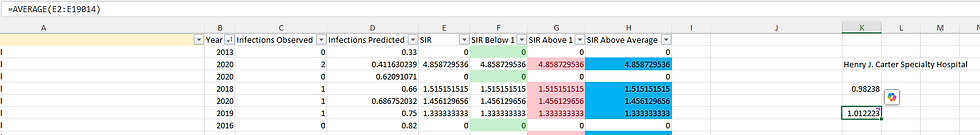
And my final calculation is to determine the SIR value of a random hospital, which I have done with the help of XLOOKUP function because it requires searching through large arrays.


Here, I try to determine of the SIR value of Henry J. Carter Specialty Hospital. For that, I use the XLOOKUP function. First, I chose the name and search it through the 'Hospital Name Cleaned' column which is an array and then I search for the matching SIR value in the SIR column.


Comments


bottom of page