

PHILADEPHIA 76ers ROSTER STATS DURING 2023 - 2024 REGULAR SEASON VERSUS 2024 PLAYOFFS PROJECT
- okanhasturkk
- 6 days ago
- 5 min read
Updated: 5 days ago
This is my POWER BI project using real data from Basketball Reference.
Dataset Source:
Project Link:
My reason for generating this project is simple. I am a longtime NBA fan and I have been wanting to learn and practice POWER BI for a long time. As in my previous projects, I worked with real-time and dirty data and cleaned them before assembling my dashboard. Here, I have analyzed, compared and visualized the individual roster stats of PHILADEPHIA 76ers in 2 areas, during the 2023 - 2024 regular season and 2024 playoffs and published my findings based on the comparisons I have made in POWER BI using DAX and visualizations.
The standardization of the raw data that I have made are as follows:


Then I imported all my 3 excel worksheet files to Power BI. Then the star schema looked like this:


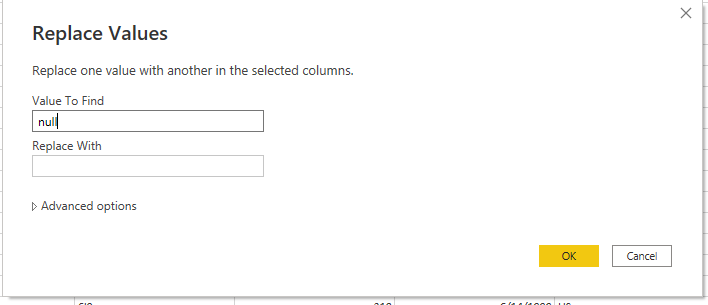
After successfully importing the tables, then I turn onto the data standardization within Power BI. Upon checking the tables, I came across some dirty like such as:


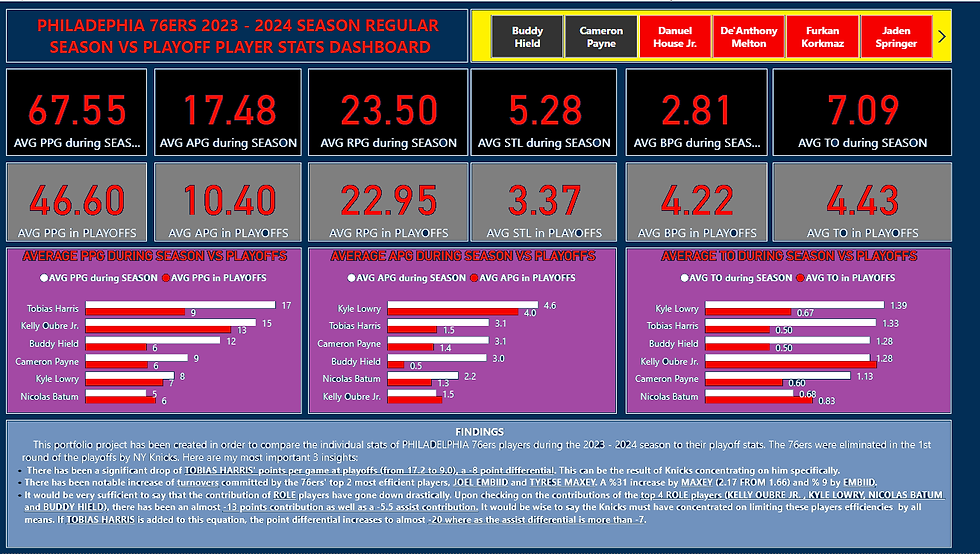
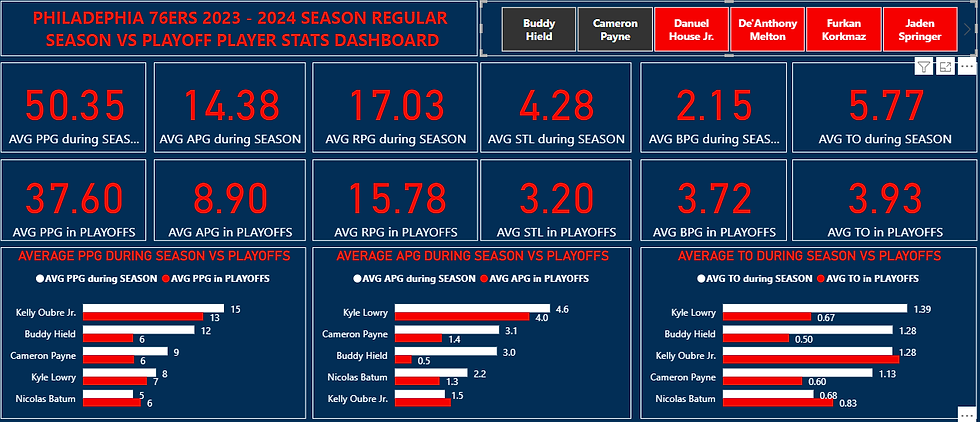
Upon assembling my dashboard, I aimed to make it very flexible, multifunctional and very easy to analyze. Here is what it consists of:
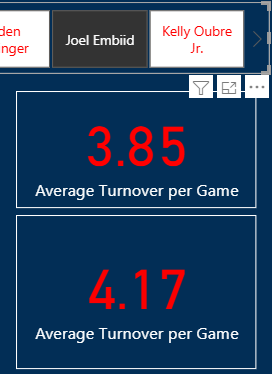
In order to establish the stat cards, I used this formula in DAX to obtain the average of the 6 stats, points, assists, rebounds, steals, blocks and turnovers in season and in playoffs.


The reason I have chosen new column instead of a measure is that although I am calculating the average stat of any player, it has been done for each row (player this instance), not whole column (team), therefore there can be no talk of an aggregation here as well as no new measure selection.
In order to make my comparison and findings accurate, I applied filters to all columns. I eliminated players, who has played so few minutes in regular season (less than 100 minutes in total). I also eliminated potential null and 0 values as well as team total row.


Now, I can compare every players stats of my choosing in regular season and playoffs. Here are some that really caught my attention.
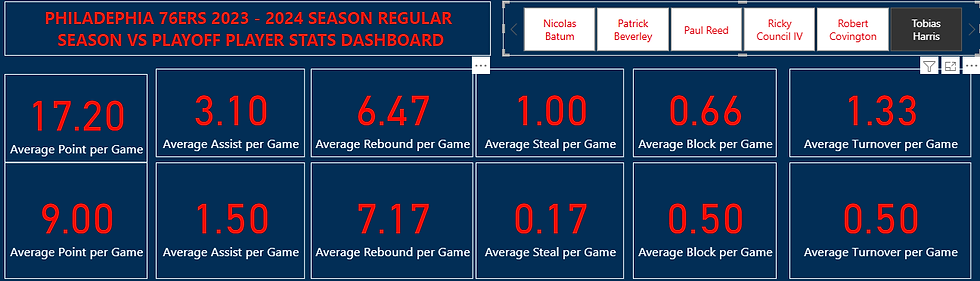

After assessing the top 3 players, I checked the role players and here is what I come up with.
Let's add Tobias Harris to this list.

Besides the cards shown above, the bottom chart clustered bar charts compare each players stats in season versus playoffs. This is what I aimed with this project, not only I manage to show individual player stats but also in multiple areas (season vs playoffs) and I am able to show each of those stats not only by 1 player but also combine with multiple players and visualize these findings with charts as well.
In the end, I inserted a text to summarize my findings. With this base, I can show, determine and visualize even more stats but I wanted to keep it clear here not so complicated. With a new column formula in DAX or an aggregation formula in a new measure, I can calculate any stats of any player of any team at any time regardless of complexity.


Comments